While growing up in London (UK) I couldn’t decide if I wanted to study engineering or the liberal arts, so I moved to the Netherlands in 2016 for university to do both.
I followed a fantastic honours programme designed to equip “social engineers” with a broad set of soft skills alongside STEM and social science courses. During that time I discovered data visualisation, a field where I could combine my love for art and design with statistics and computer science. The exciting part about data visualisation to me, is the challenge of discovering unique and engaging ways of (truthfully) visualising data, while ensuring the information remains intelligible so that one can tell persuasive stories with calls to action.
Realising that the data I enjoyed visualising the most tended to be spatio-temporal data (geographic data that is subject to change over time), led me to starting a two-year master’s degree in Geomatics in September 2020, at Delft University of Technology. I am now an MSc. engineering graduate, always on the lookout for projects where I can combine my education in mapping and computing with my experience in art and design.
I draw and paint (traditionally, and sometimes digitally) both for fun and for commissioned graphic design work. You can find some of my personal art on this page. Other things that make me smile include designing dream homes, good quality ice cream, and the mountains.
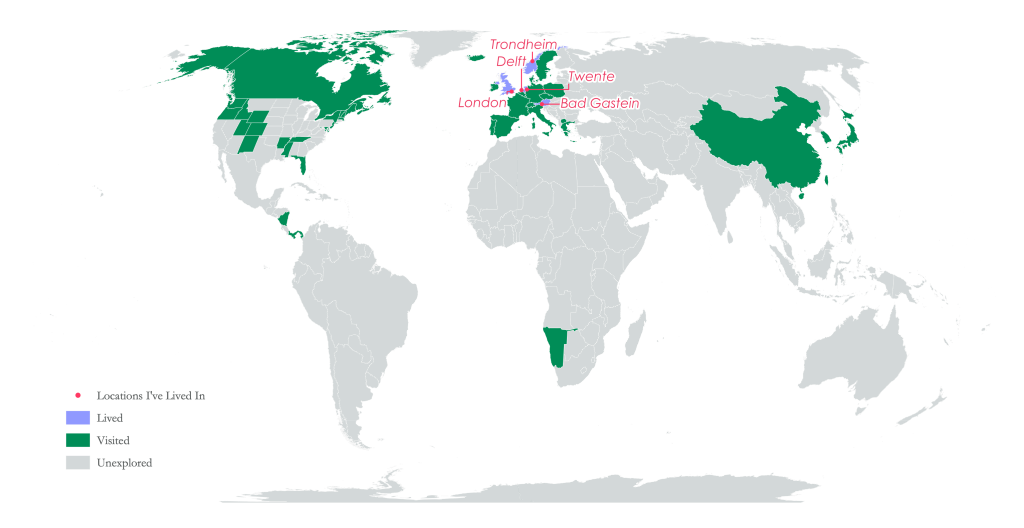
Places I’ve been

My most recently read books on Goodreads
f


